 What separates a successful B2B Revenue Operations (RevOps) strategy from one that crashes and burns?
There are, of course, several correct answers to this question. But there’s one that comes up a lot, and it involves tracking.
You really need to be able to measure your RevOps activities accurately and effectively. Figure out how to do this, and your RevOps strategy will be better positioned to succeed. You will also be better able to align your people, processes, and technology to drive more reliable business growth: one of the main reasons business leaders are exploring RevOps.
But where do you start? What metrics, at a minimum, should you be tracking and why? We cover some of the most important metrics to track as one of several revenue operations best practices in this blog and provide you with the details on how to calculate them. Take a look.
Top 8 B2B RevOps Metrics to Track and Measure
1. Annual Recurring Revenue (ARR)
ARR is a measure of the recurring revenue your business generates. It’s important because it serves as a good indicator of how financially stable your business is and its potential for growth.
Strong performance on this metric generally means your business is healthy and sustainable. It also means that you have succeeded in building a consistent revenue stream. But that’s not all.
Tracking ARR is also important for forecasting and planning your RevOps activities for the month, quarter, or year. Likewise, it provides additional insights into how to drive operational efficiency, adapt your pricing strategy, and inform your sales, marketing, and customer success/support strategy.
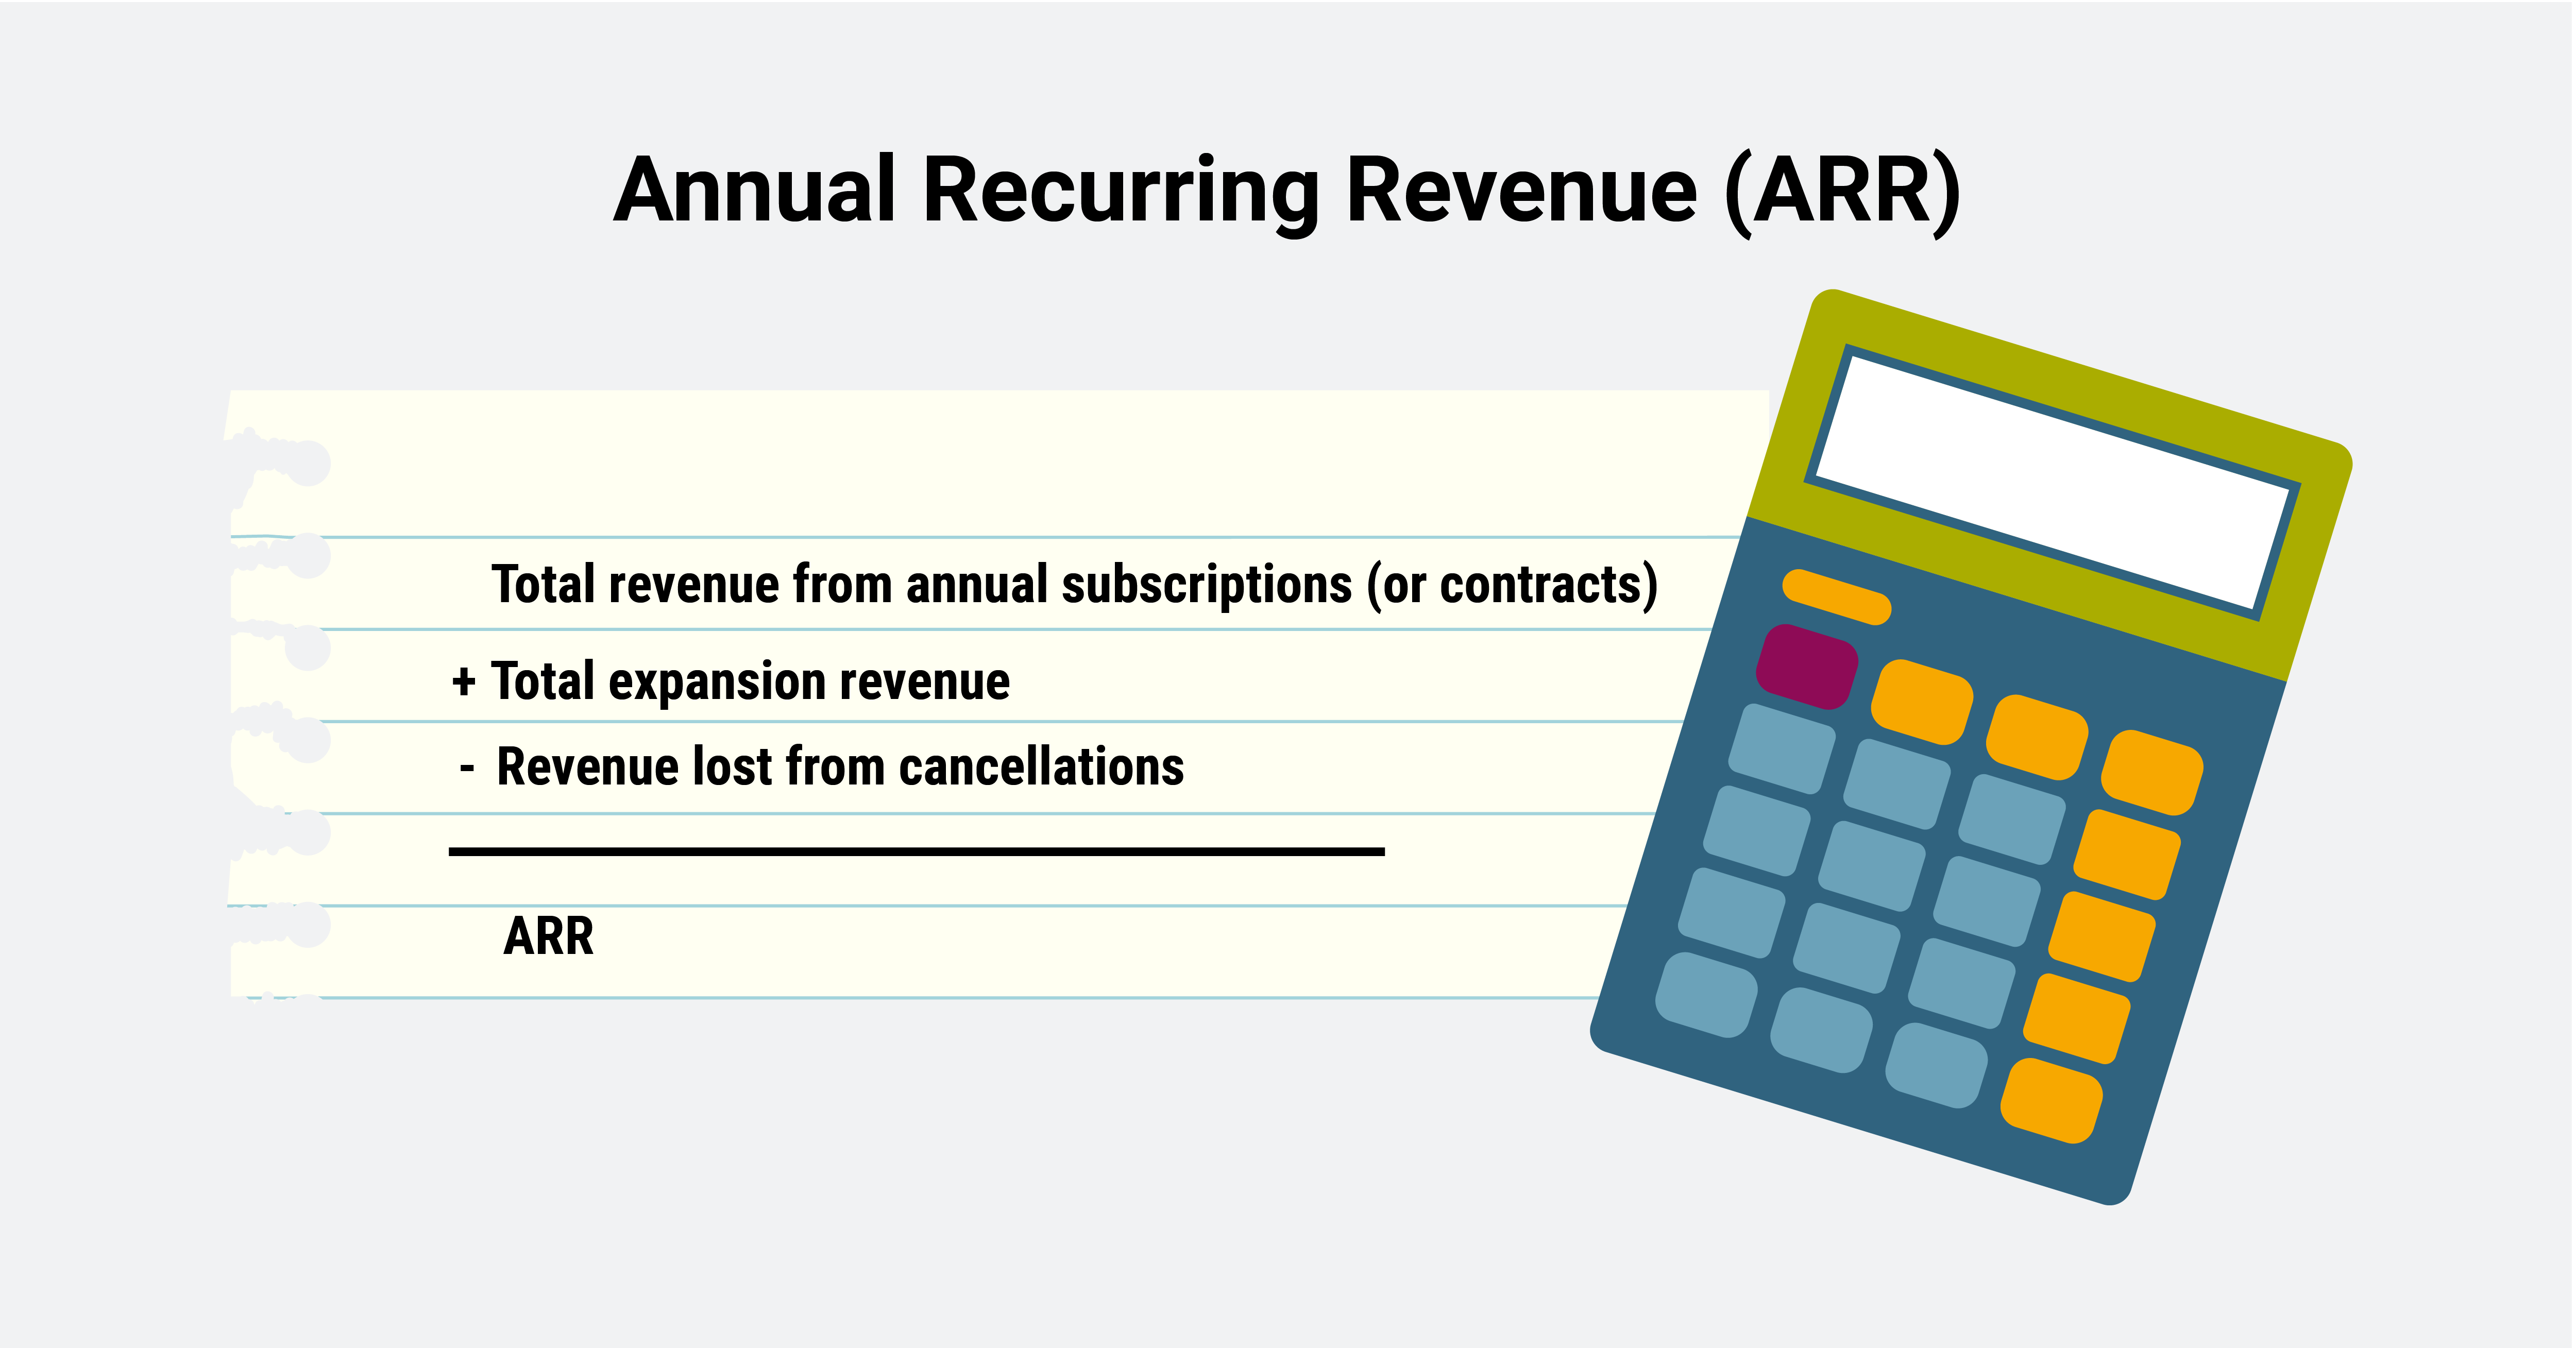
To that end, here’s how to calculate ARR: take the total combined revenue from all your annual subscriptions, add any expansion revenue (additional revenue from activities like upsells and addons from recurring customers), and subtract any revenue lost from canceled subscriptions or contracts.
Formula: ARR = Total revenue from annual subscriptions + total expansion revenue - revenue lost from cancelations
2. Revenue Retention
Generating revenue is one thing, but it’s the ability to retain that revenue over time that really makes a successful and sustainable business. The revenue retention metric measures how well your business does that.
Revenue retention is a combination of several factors like customer satisfaction, revenue stability, and the success of your products over time. There are two main ways to calculate revenue retention:
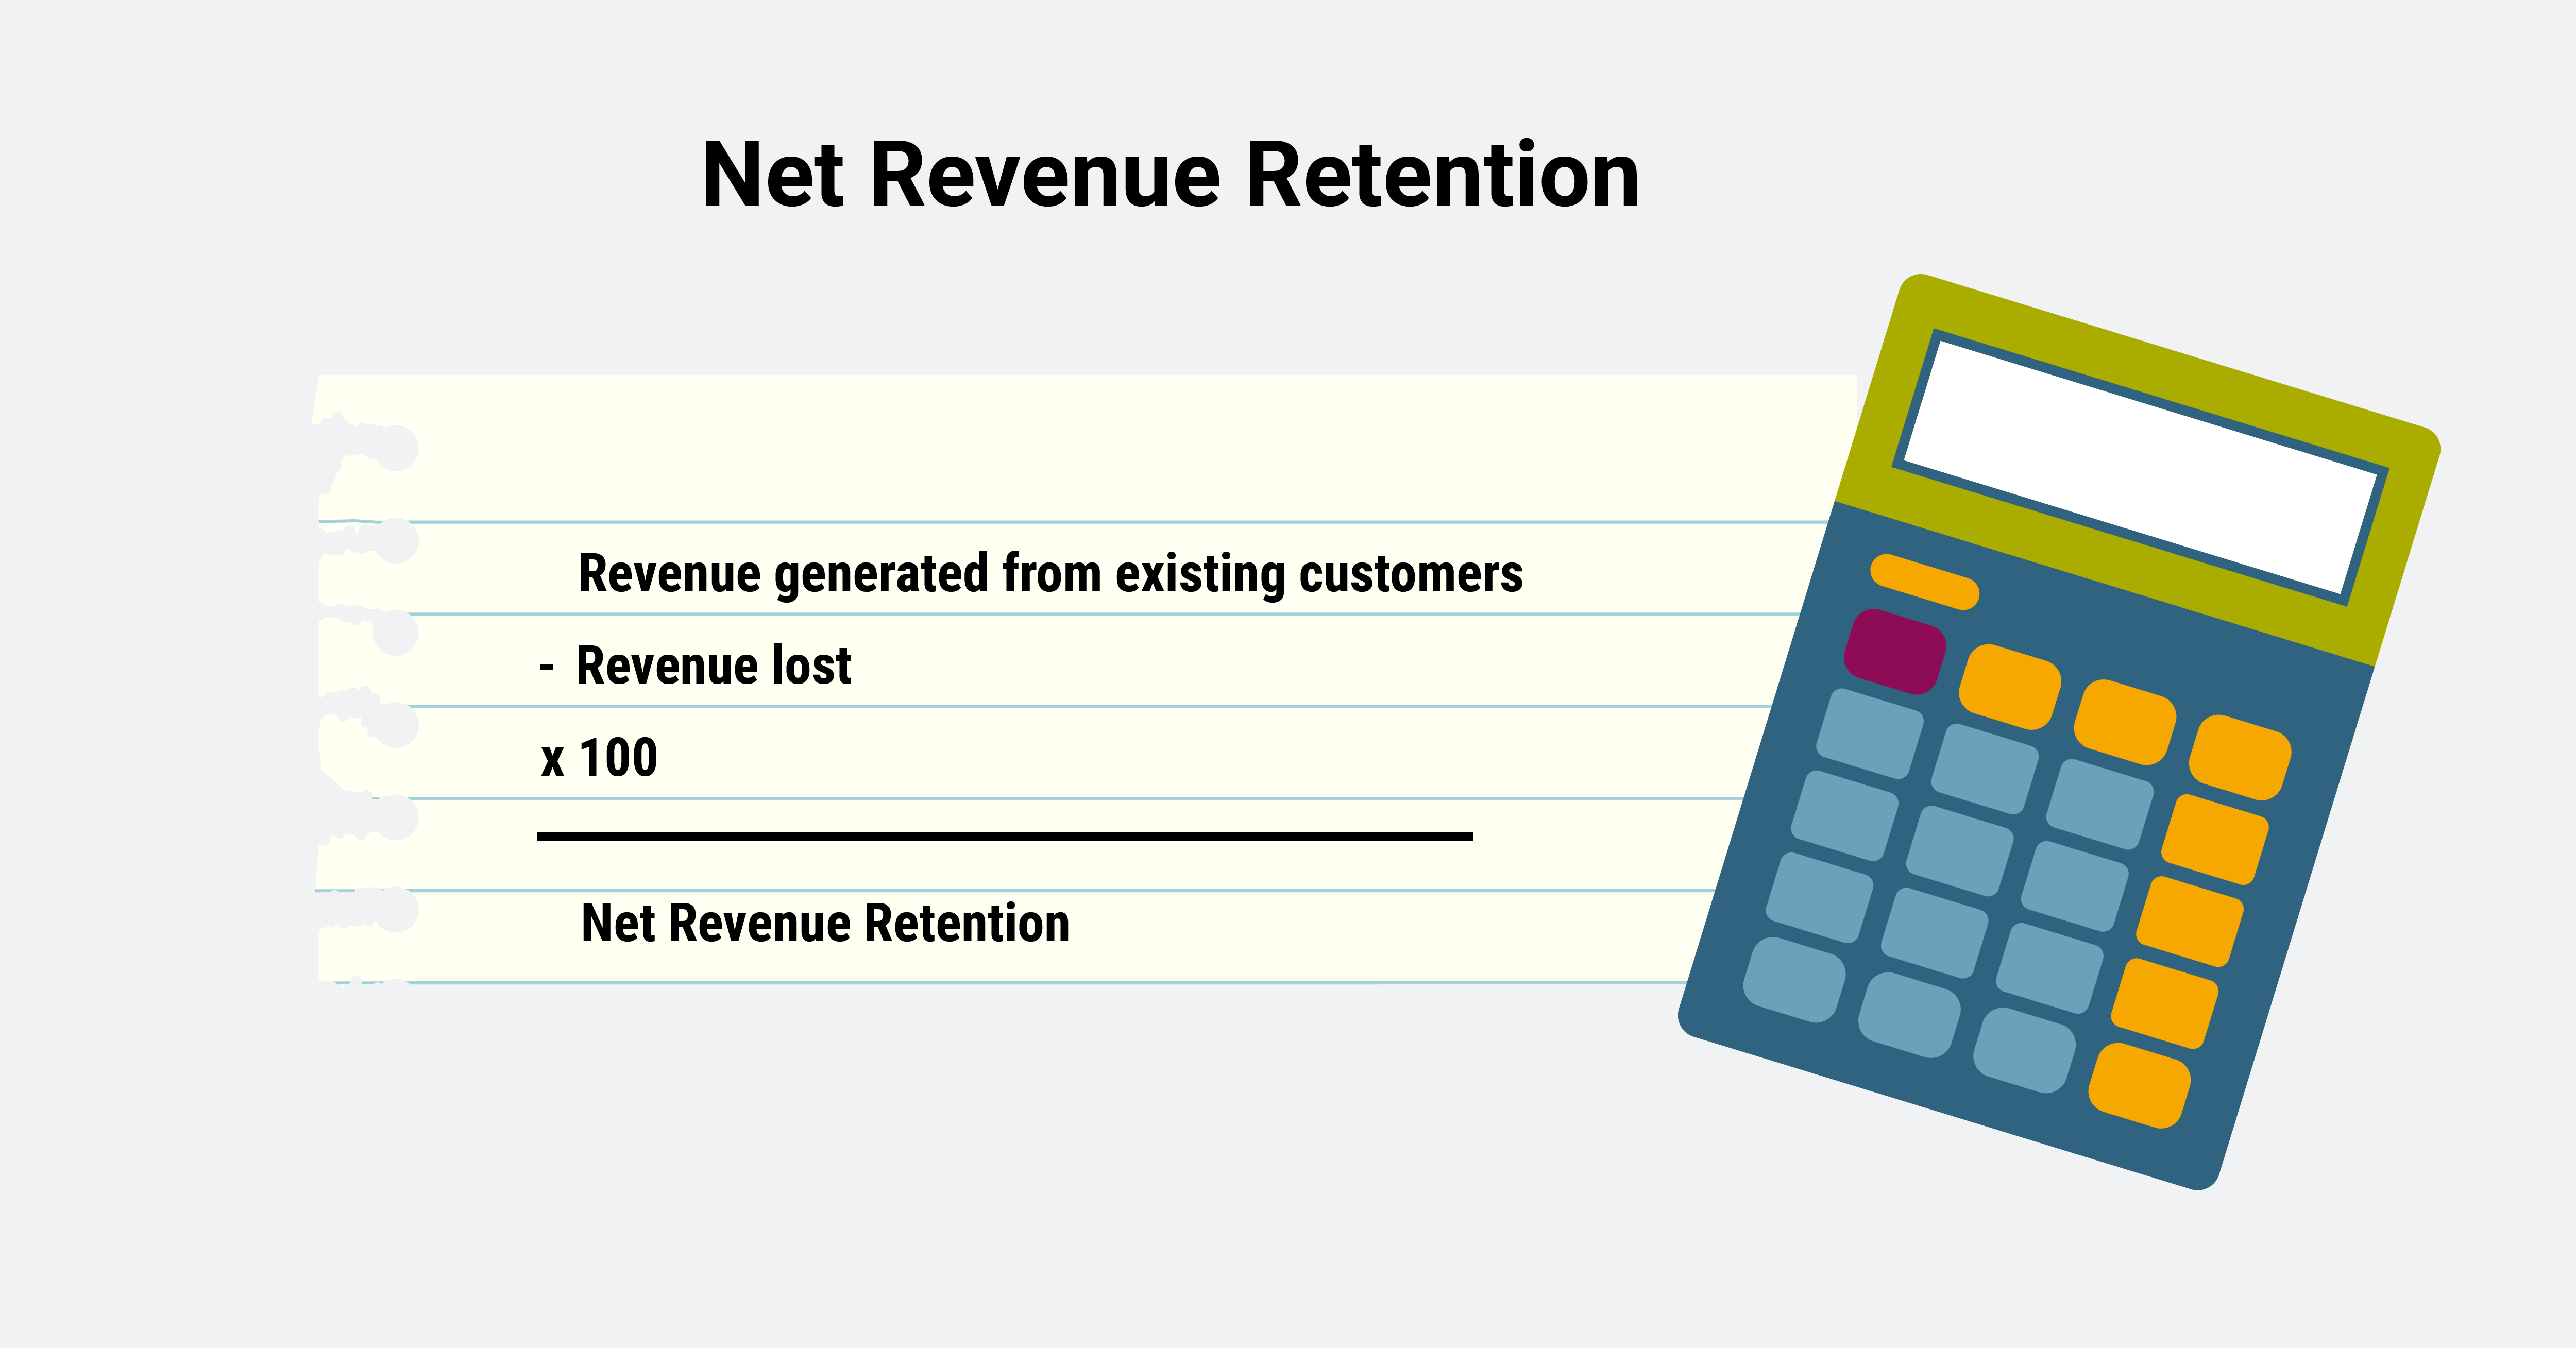
- Net Revenue Retention: involves calculating the revenue generated from existing customers over the course of a given period (for example, a year), and then subtracting the revenue lost from things like canceled subscriptions and downgrades. Multiply the result by 100 to get a percentage.
- Gross Revenue Retention: is the same calculation as net revenue retention but considers additional factors like upsells when calculating revenue generated.
3. Average Contract Value (ACV)
Think of ACV as the heartbeat of your contractual relationships. It provides a check on the average value each contract brings to the table and offers insights into your deal size and the amount of revenue it has for the year(s).
On its own, the ACV may not seem significant. But when compared to customer acquisition cost (CAC), for example, you can learn how much effort or spend it takes your team to secure that customer and what you can do to make that process more efficient should your CAC, in this case, be high and contract value low.
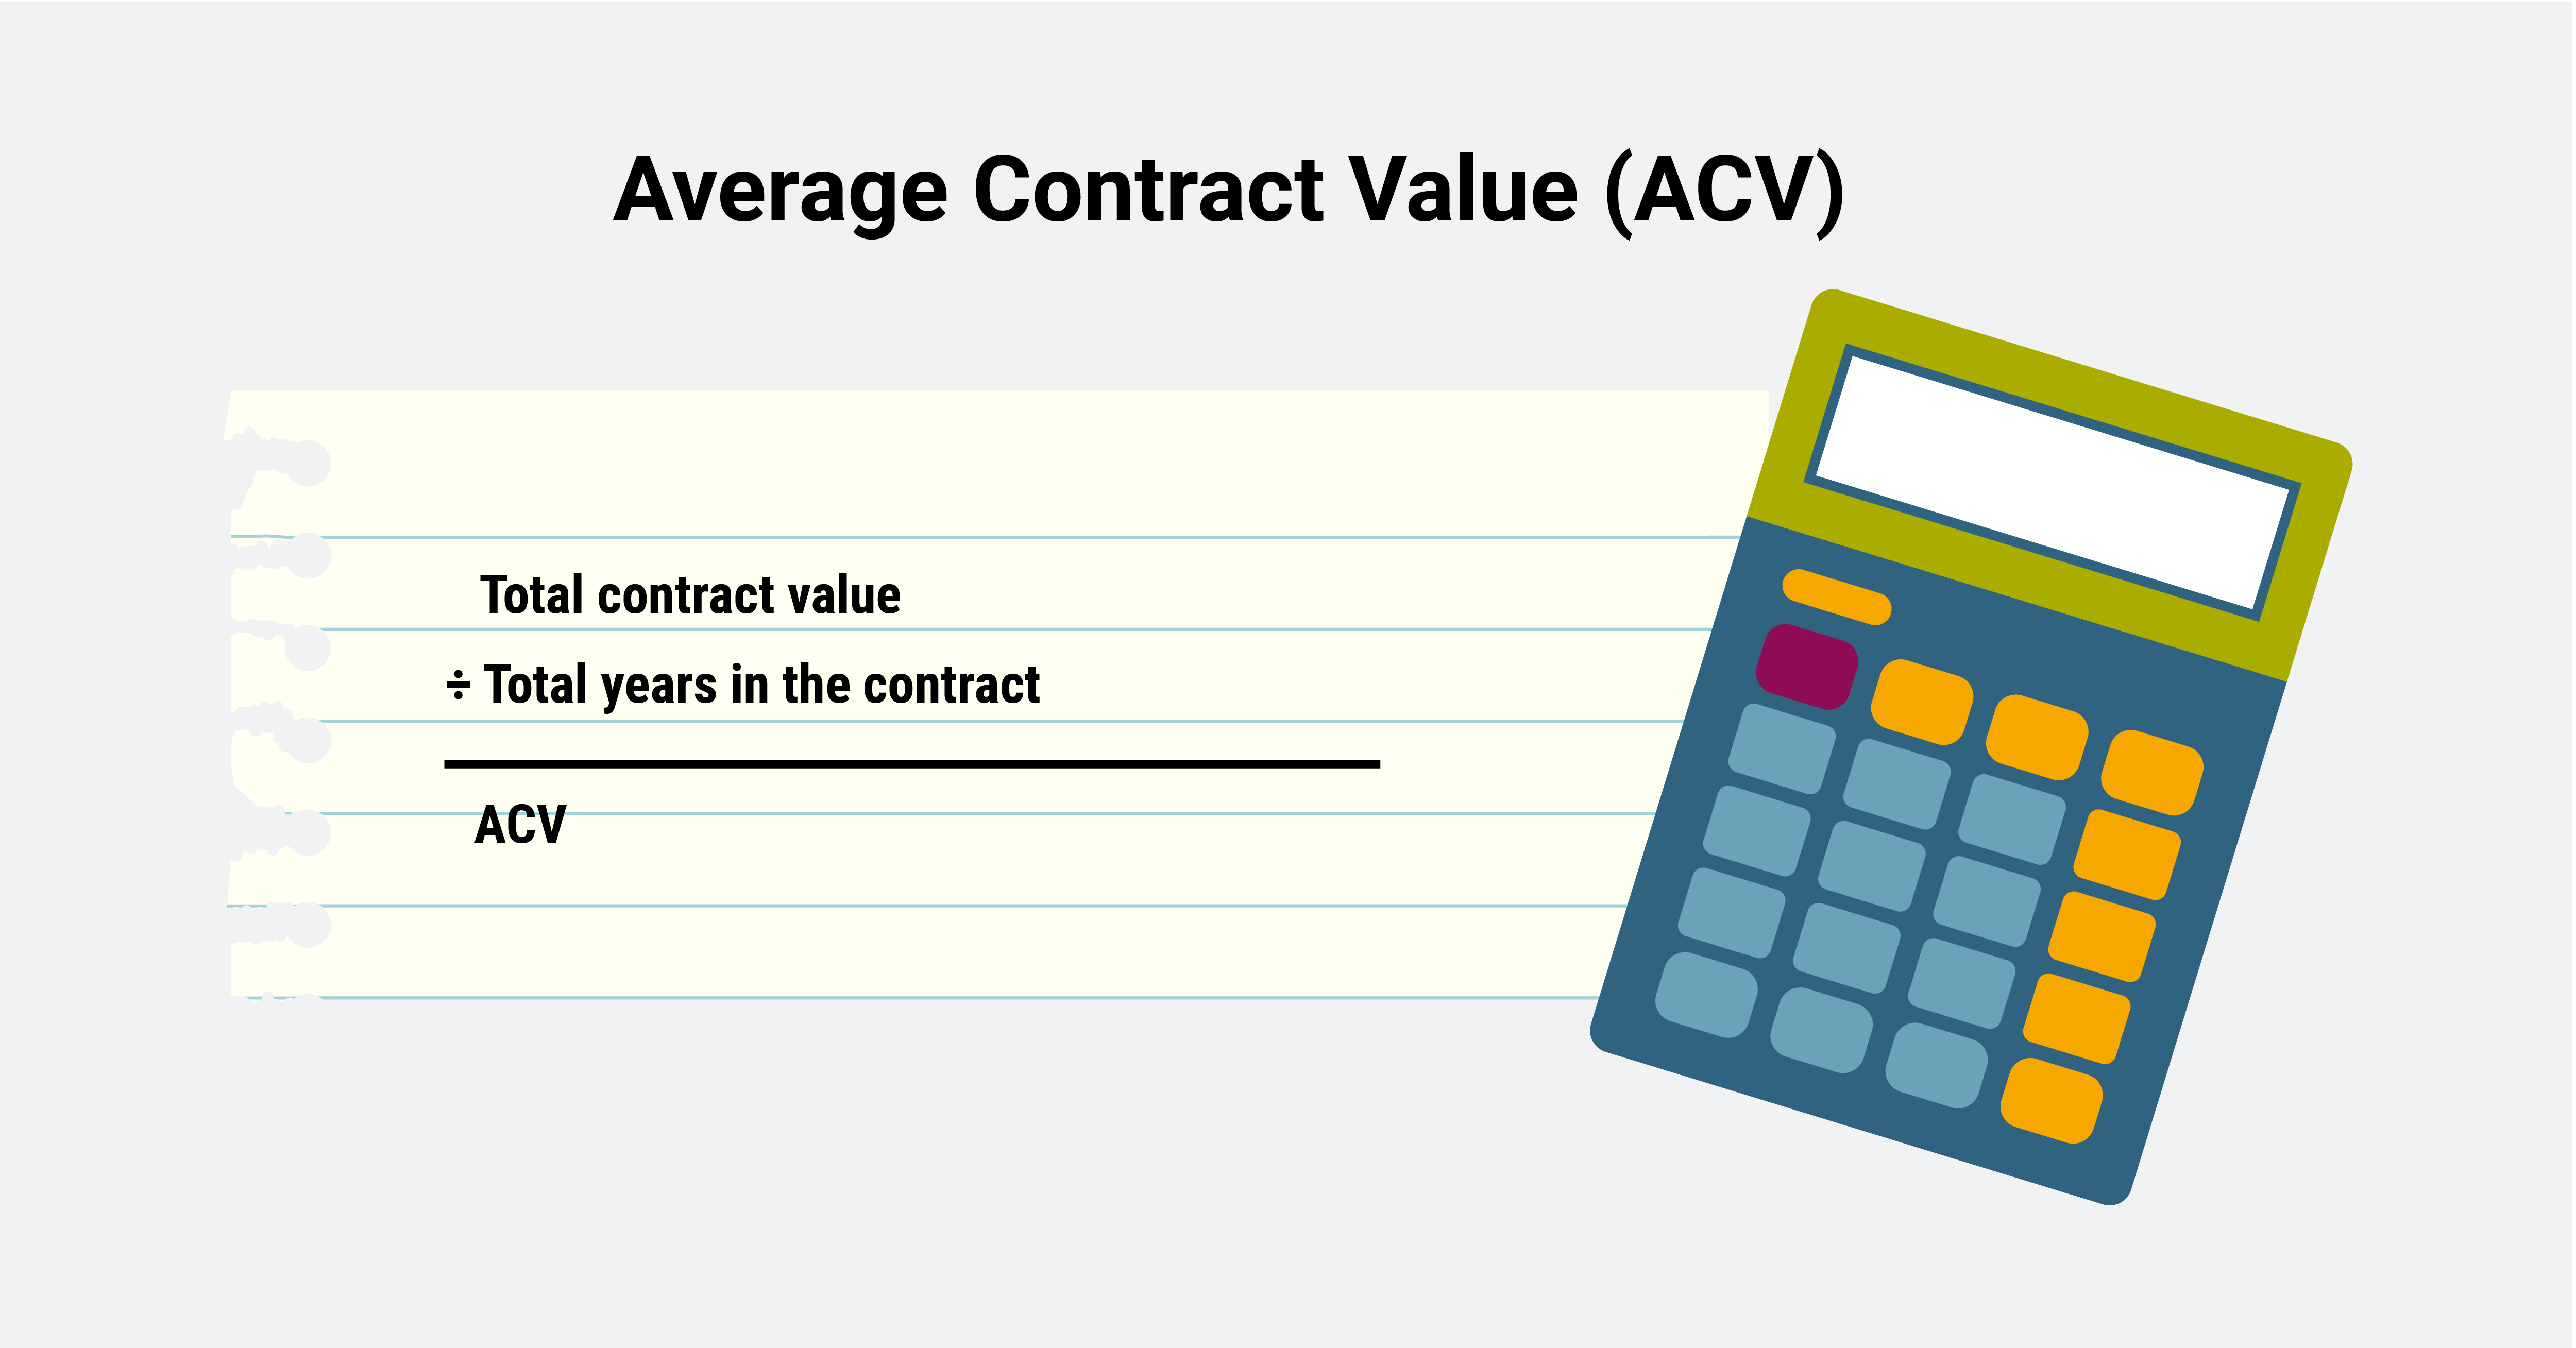
Unlike most metrics listed on this blog, the average contract value is not an industry-standard metric. That’s because most businesses employ their own way of calculating this number. One calculation you could use and modify to get your ACV is to divide the total contract value by the total number of years in the contract.
Formula for average contract value: total contract value/total years in the contract.
4. Customer Lifetime Value (CLV)
RevOps is all about generating repeatable and sustainable revenue growth. Customer lifetime Value (CLV), can help you achieve the level of predictability you’re looking for under the RevOps model.
CLV is the one metric that can quickly give you a bird’s eye view of a customer’s value with your business over time. When you have a strong grasp on the CLV, you’re better able to make decisions on attracting and retaining customers long-term.
A high CLV means your business has strong customer relationships and can be a good indicator for increasing revenue long term while reducing CAC over time. A low or declining CLV, on the other hand, can indicate customer engagement and retention issues. In that case, you’ll want to revisit and optimize your customer journey and experience for improvements.
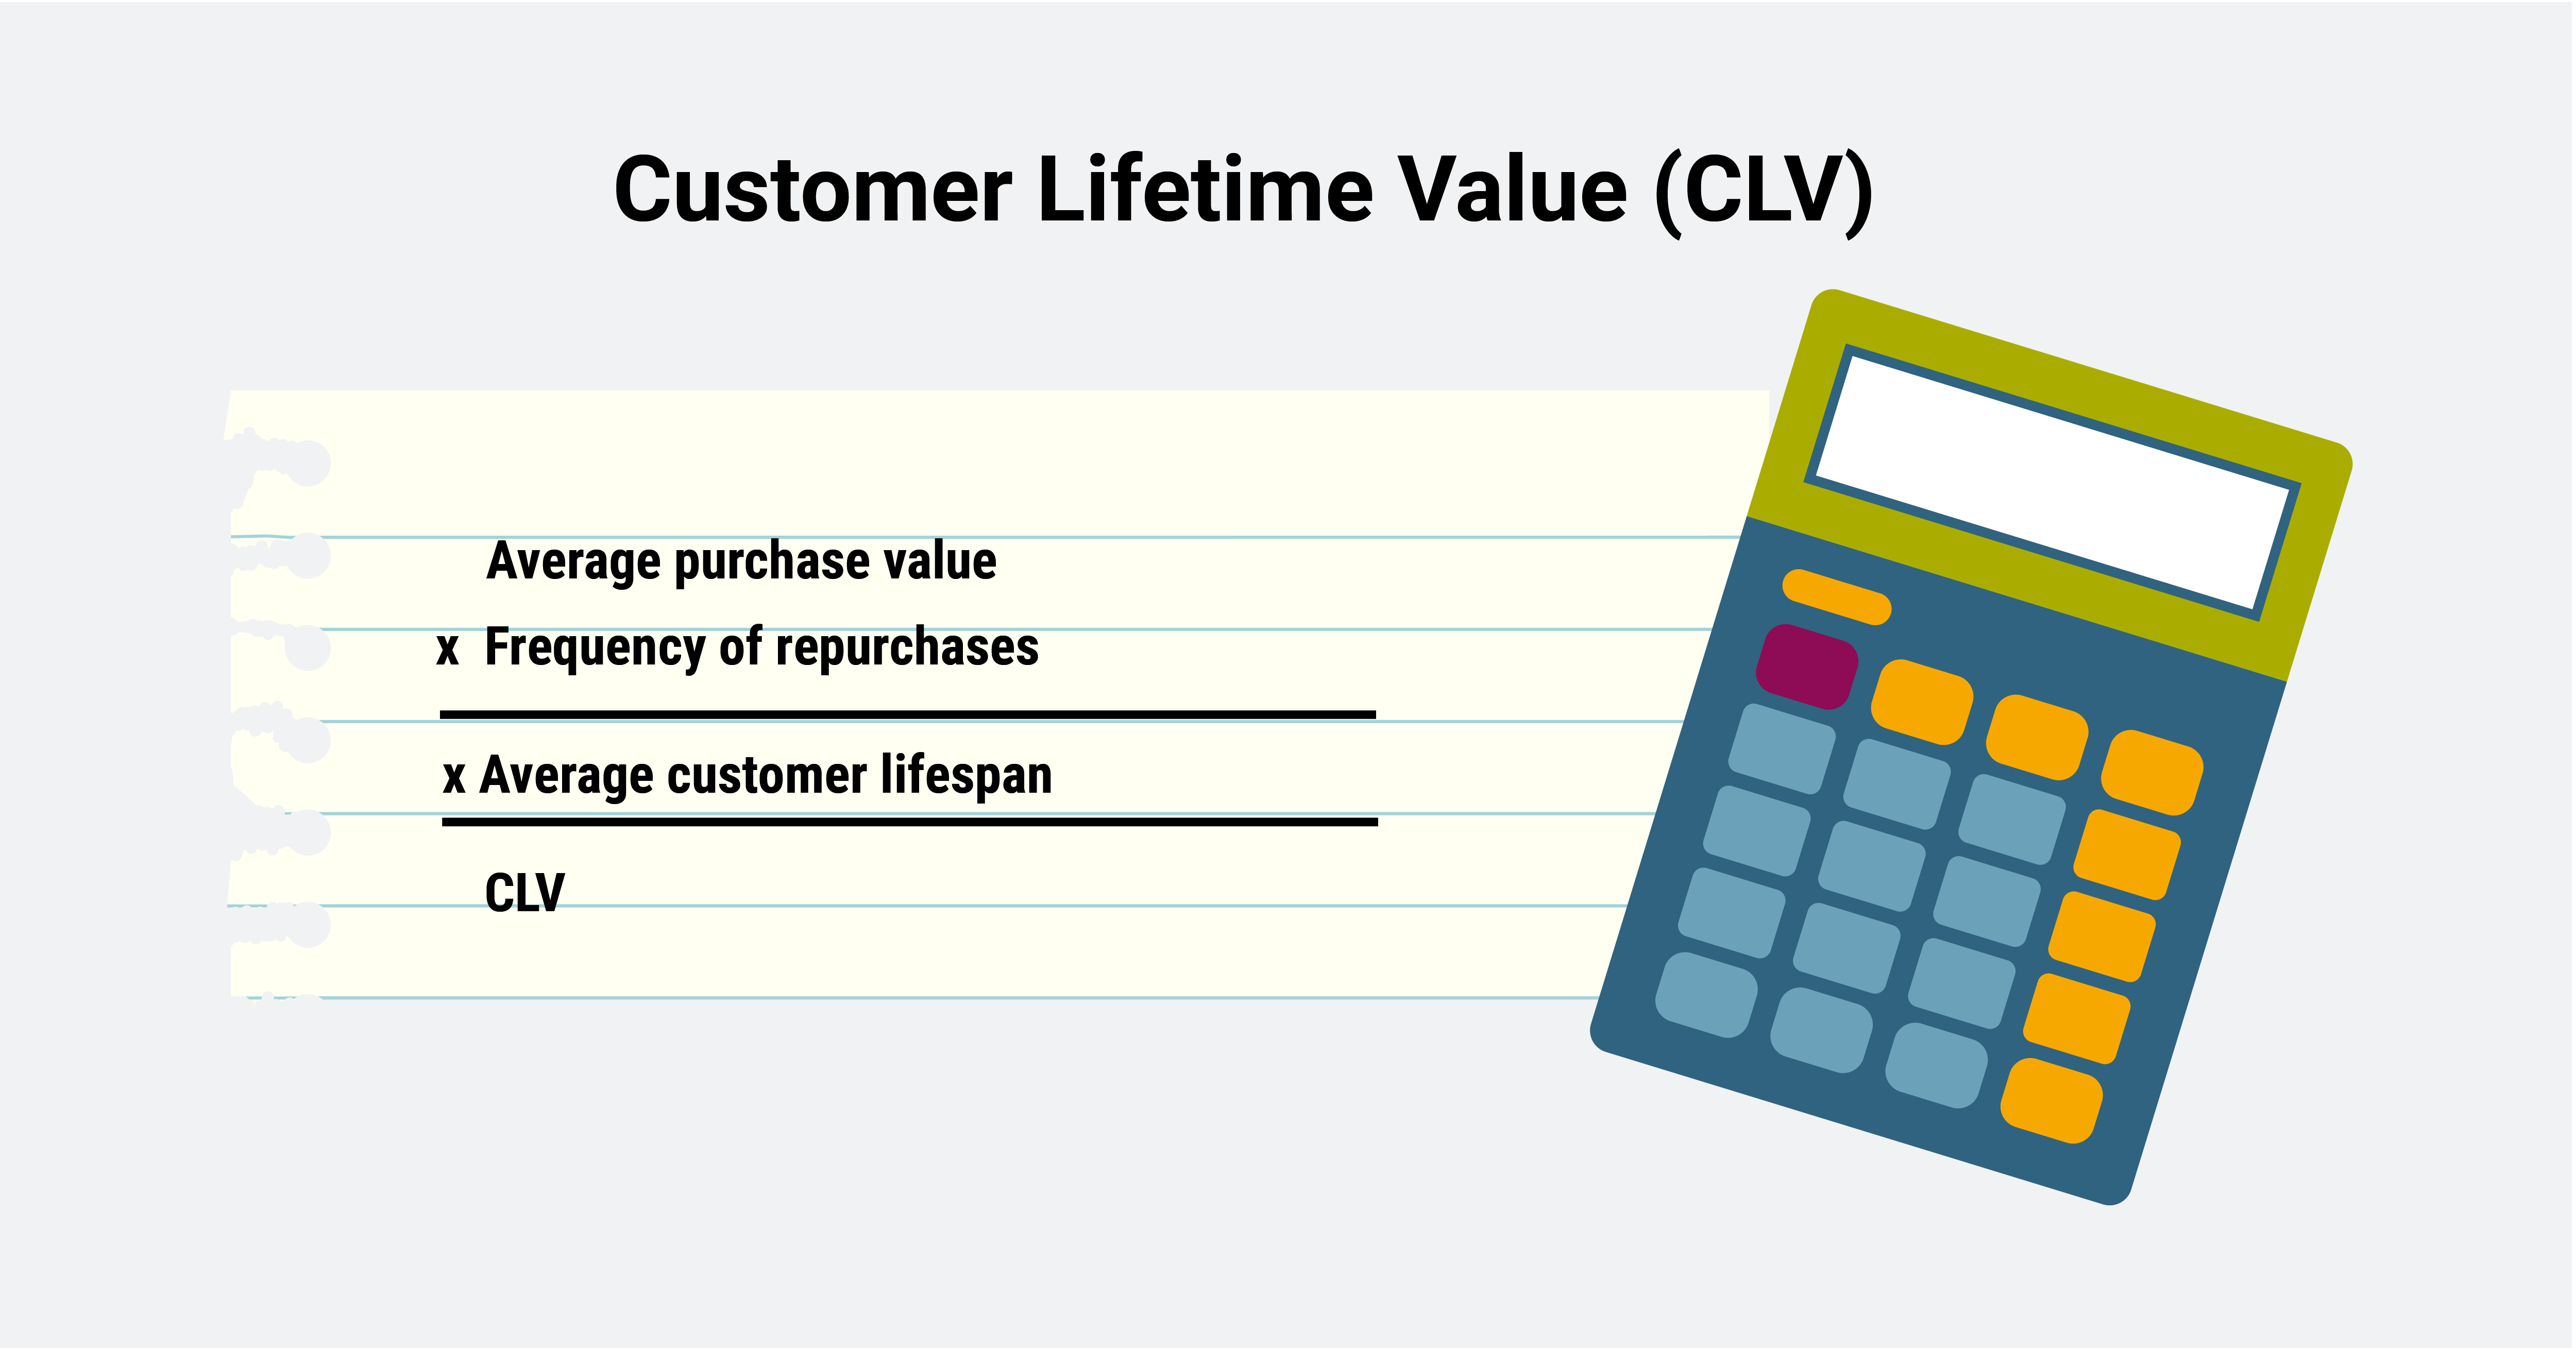
Determining your CLV is simple. Start by multiplying the frequency of purchases by the average purchase value. Once you have that number, multiply it by the average customer lifespan number.
Formula for CLV = (Average purchase value x Frequency of repurchases) x Average customer lifespan
5. Customer Churn
The number of customers you attract is, in the long run, less important than the number you successfully hold on to. Tracking this is key as it will provide you with insights into what activities and experiences drive customer stickiness.
Customer churn is a measure of the rate at which customers stop paying for your services. If churn rates are high, it means there’s a problem with your business and customers are not seeing a good reason to stay on board, which could be an indicator of all kinds of problems. From a RevOps perspective, very high churn rates show that your current business is not sustainable.
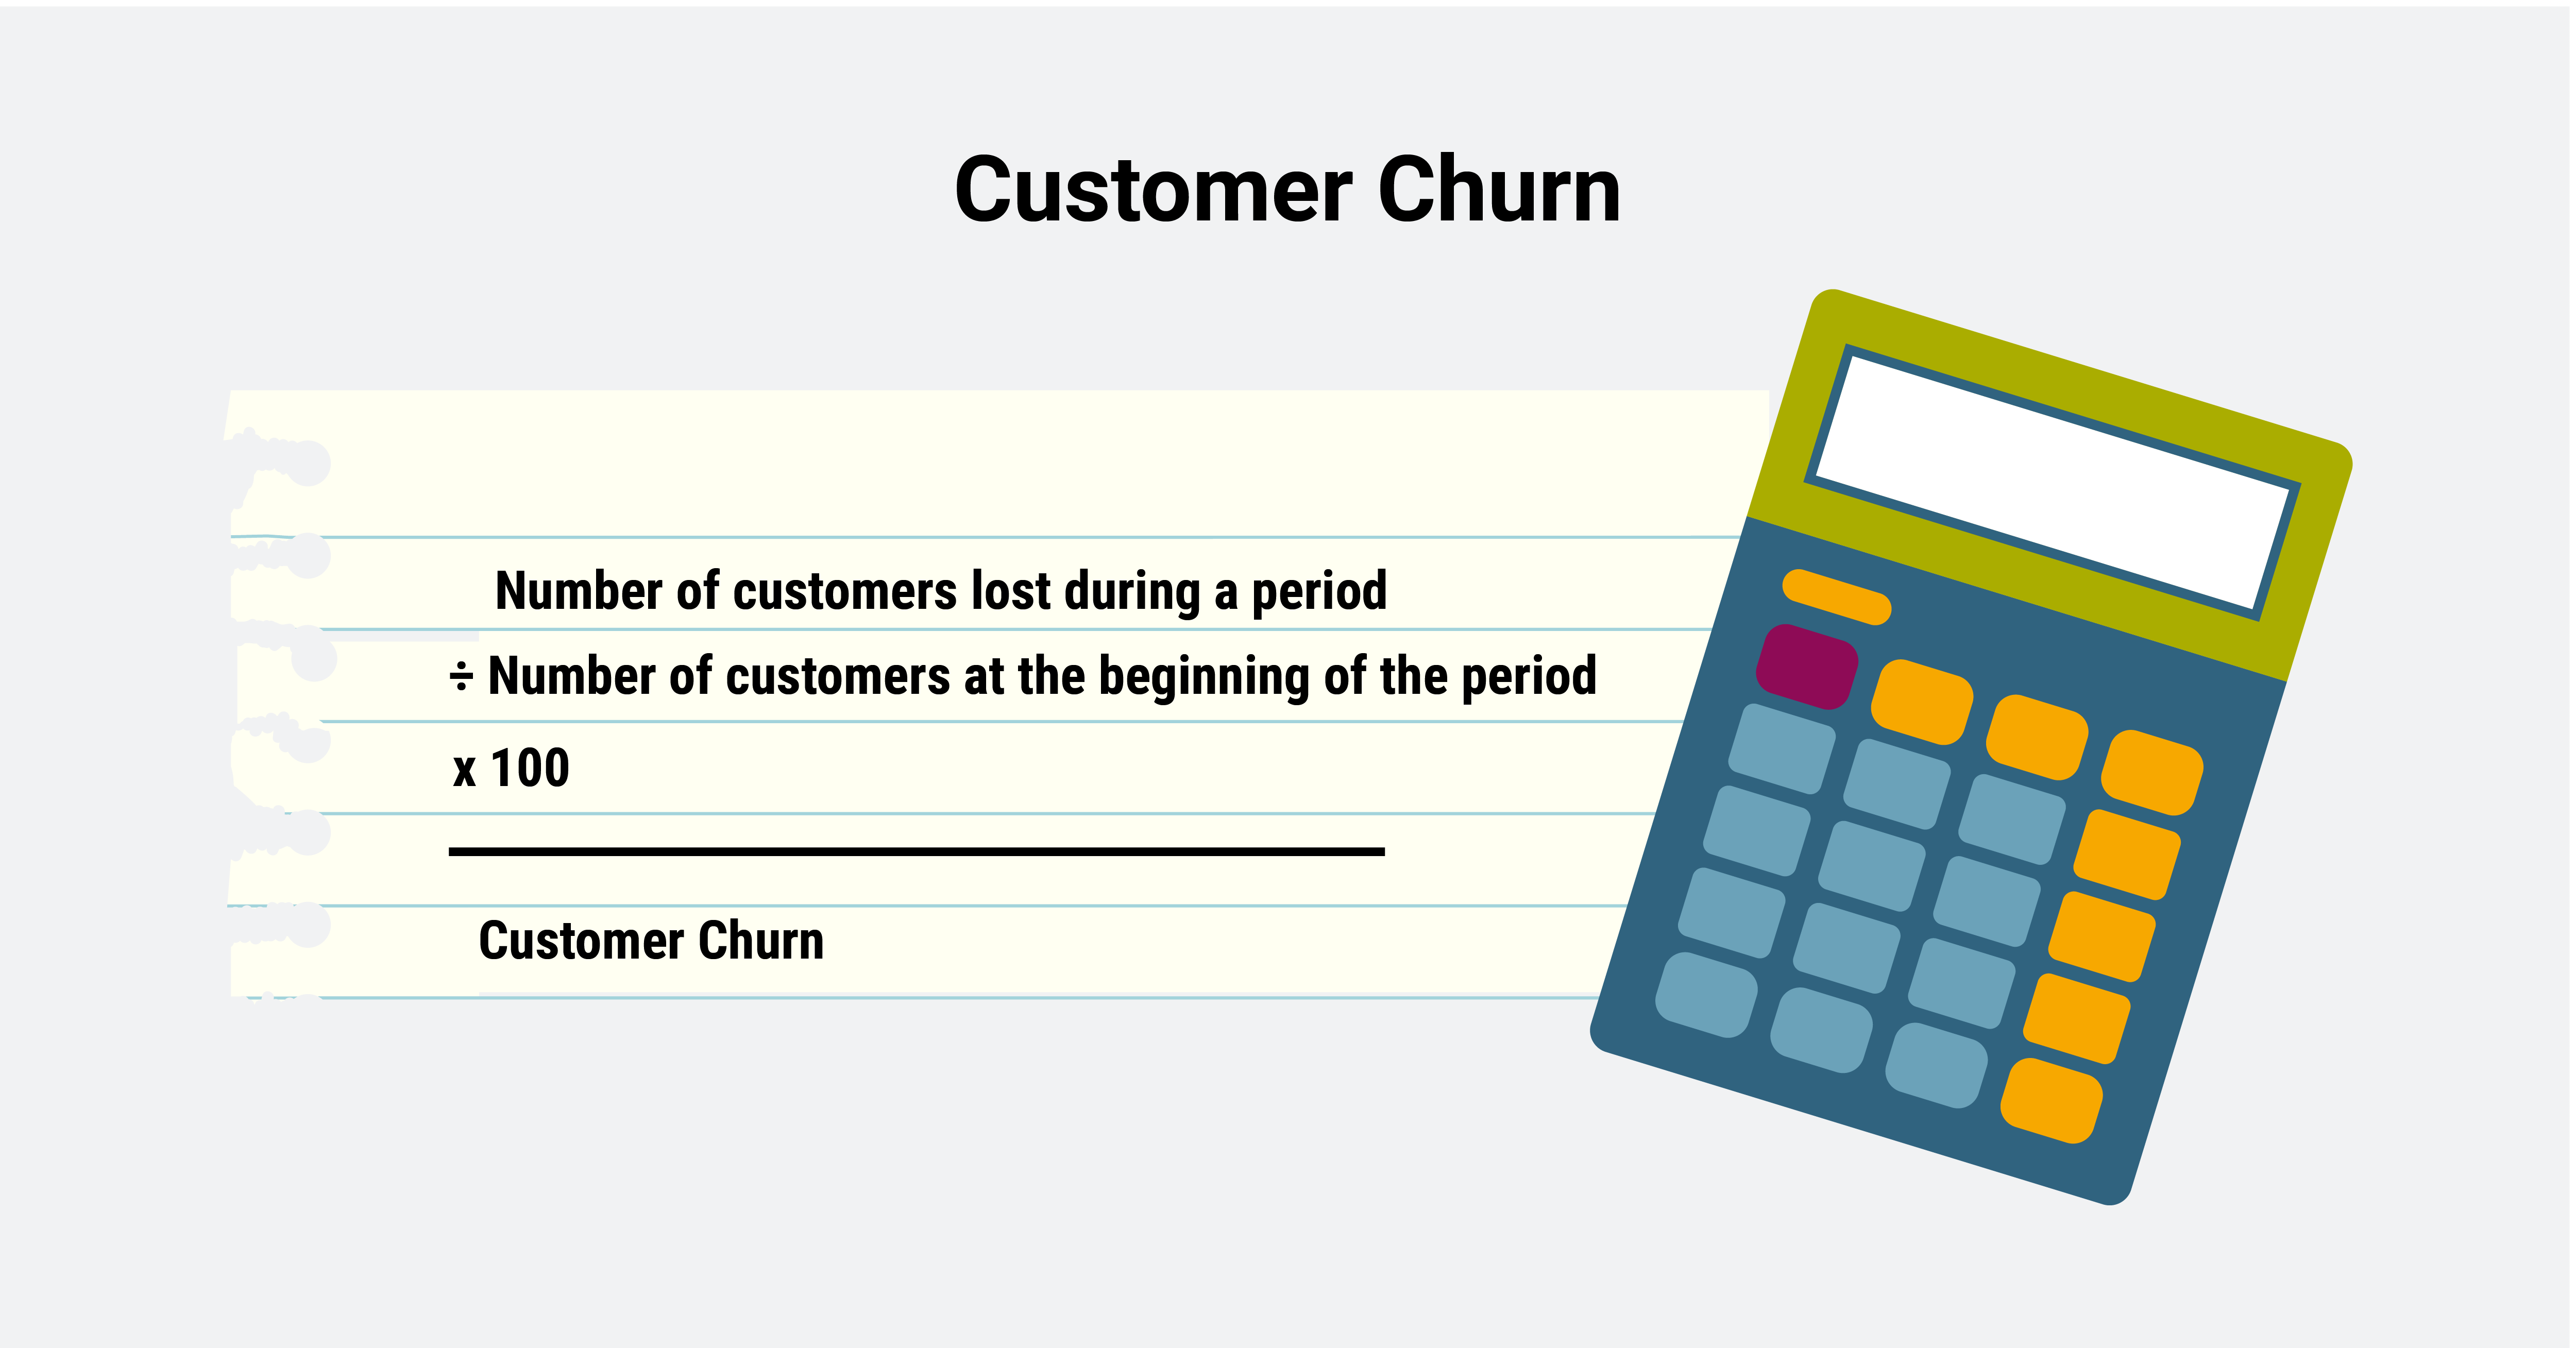
To calculate customer churn, take the number of customers you lost during a certain period and divide that number by the customers you had at the beginning of the period. Then multiply by 100 to get a percentage.
Formula for customer churn: Number of customers lost during a period/number of customers at the beginning of the period x 100
6. Cost Per Acquisition (CPA)
Cost Per Acquisition is a measure of the average cost of acquiring a new customer. This is an important RevOps metric for sales and marketing teams, as it can help you understand how efficiently your activities are generating revenue.
There are lots of costs involved in acquiring new customers — from marketing and sales salaries to ad spend and agency fees. A high Cost Per Acquisition is a sign that you’re not using your resources in an optimal way and can suggest problems with messaging, product-market fit, and marketing channels.
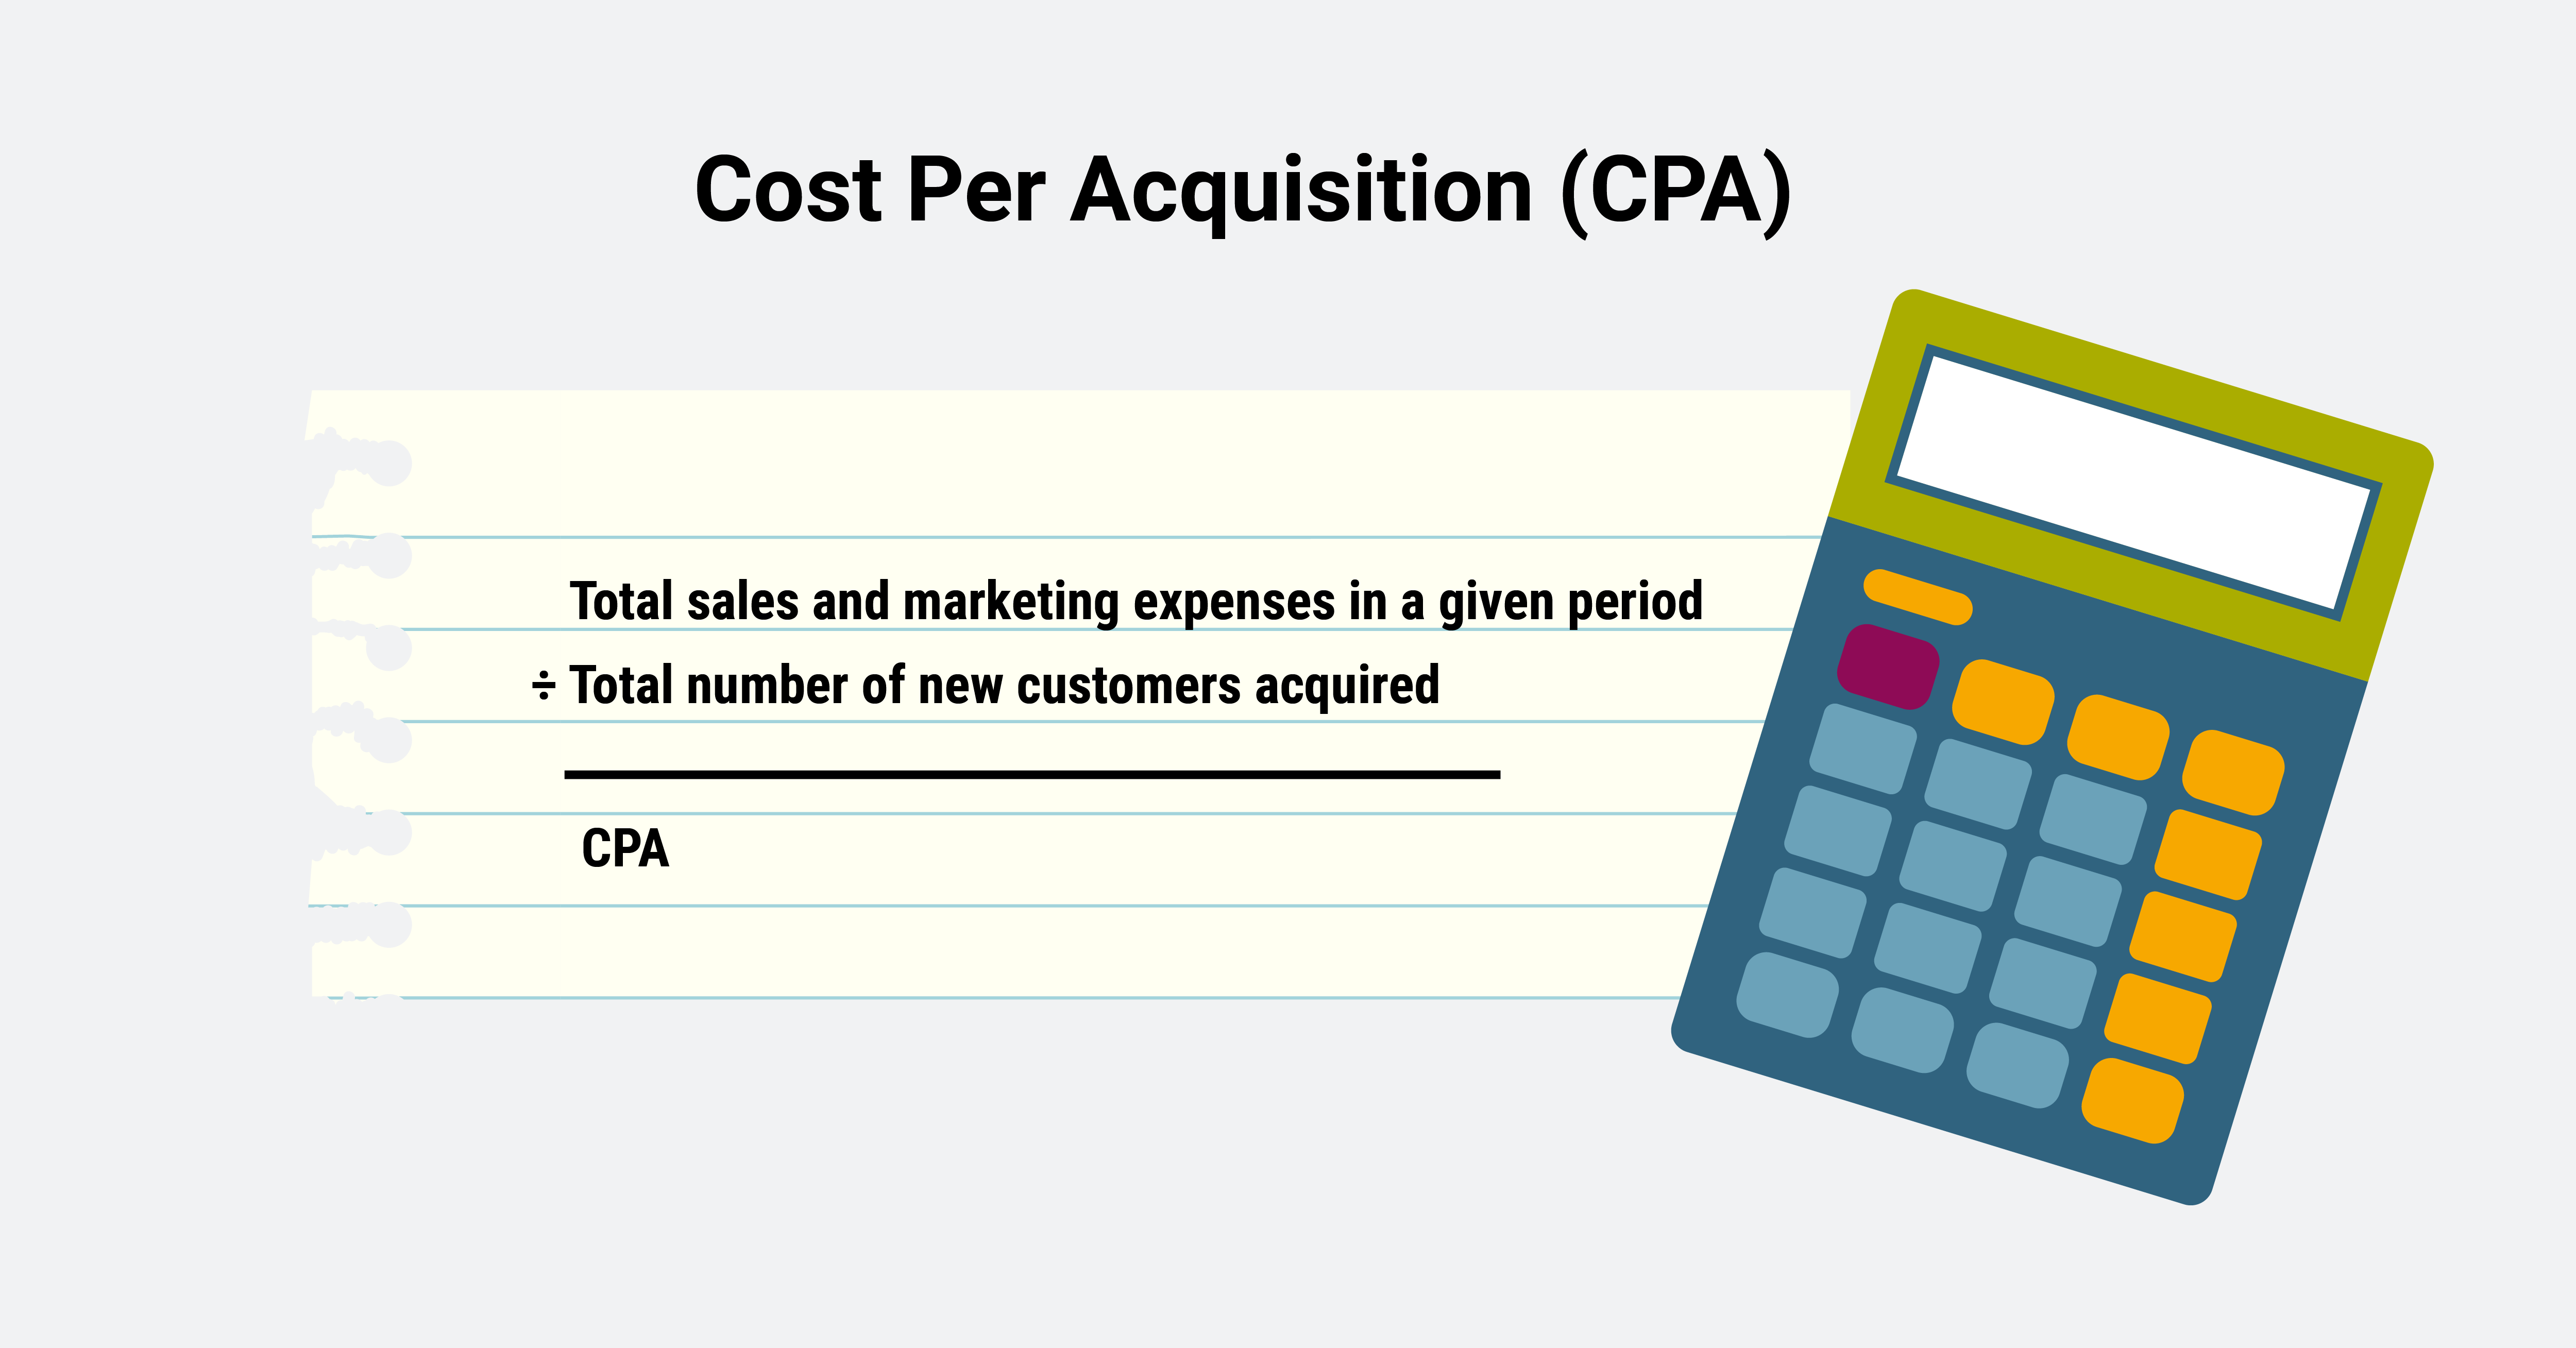
To calculate CPA, divide the total sales and marketing expenses in a given period by the number of new customers you acquired in that period.
Formula for CPA: CPA = total sales and marketing expenses in a given period/total number of new customers acquired
7. Pipeline Velocity
Pipeline velocity is a measure of how fast your leads move through the sales funnel. How long does it take, on average, for a lead to become a paying customer?
This metric can teach you a lot. It can provide some great insights into how efficient and streamlined your sales process is, help you identify any areas of friction or bottlenecks, and drive concrete action to increase revenue.
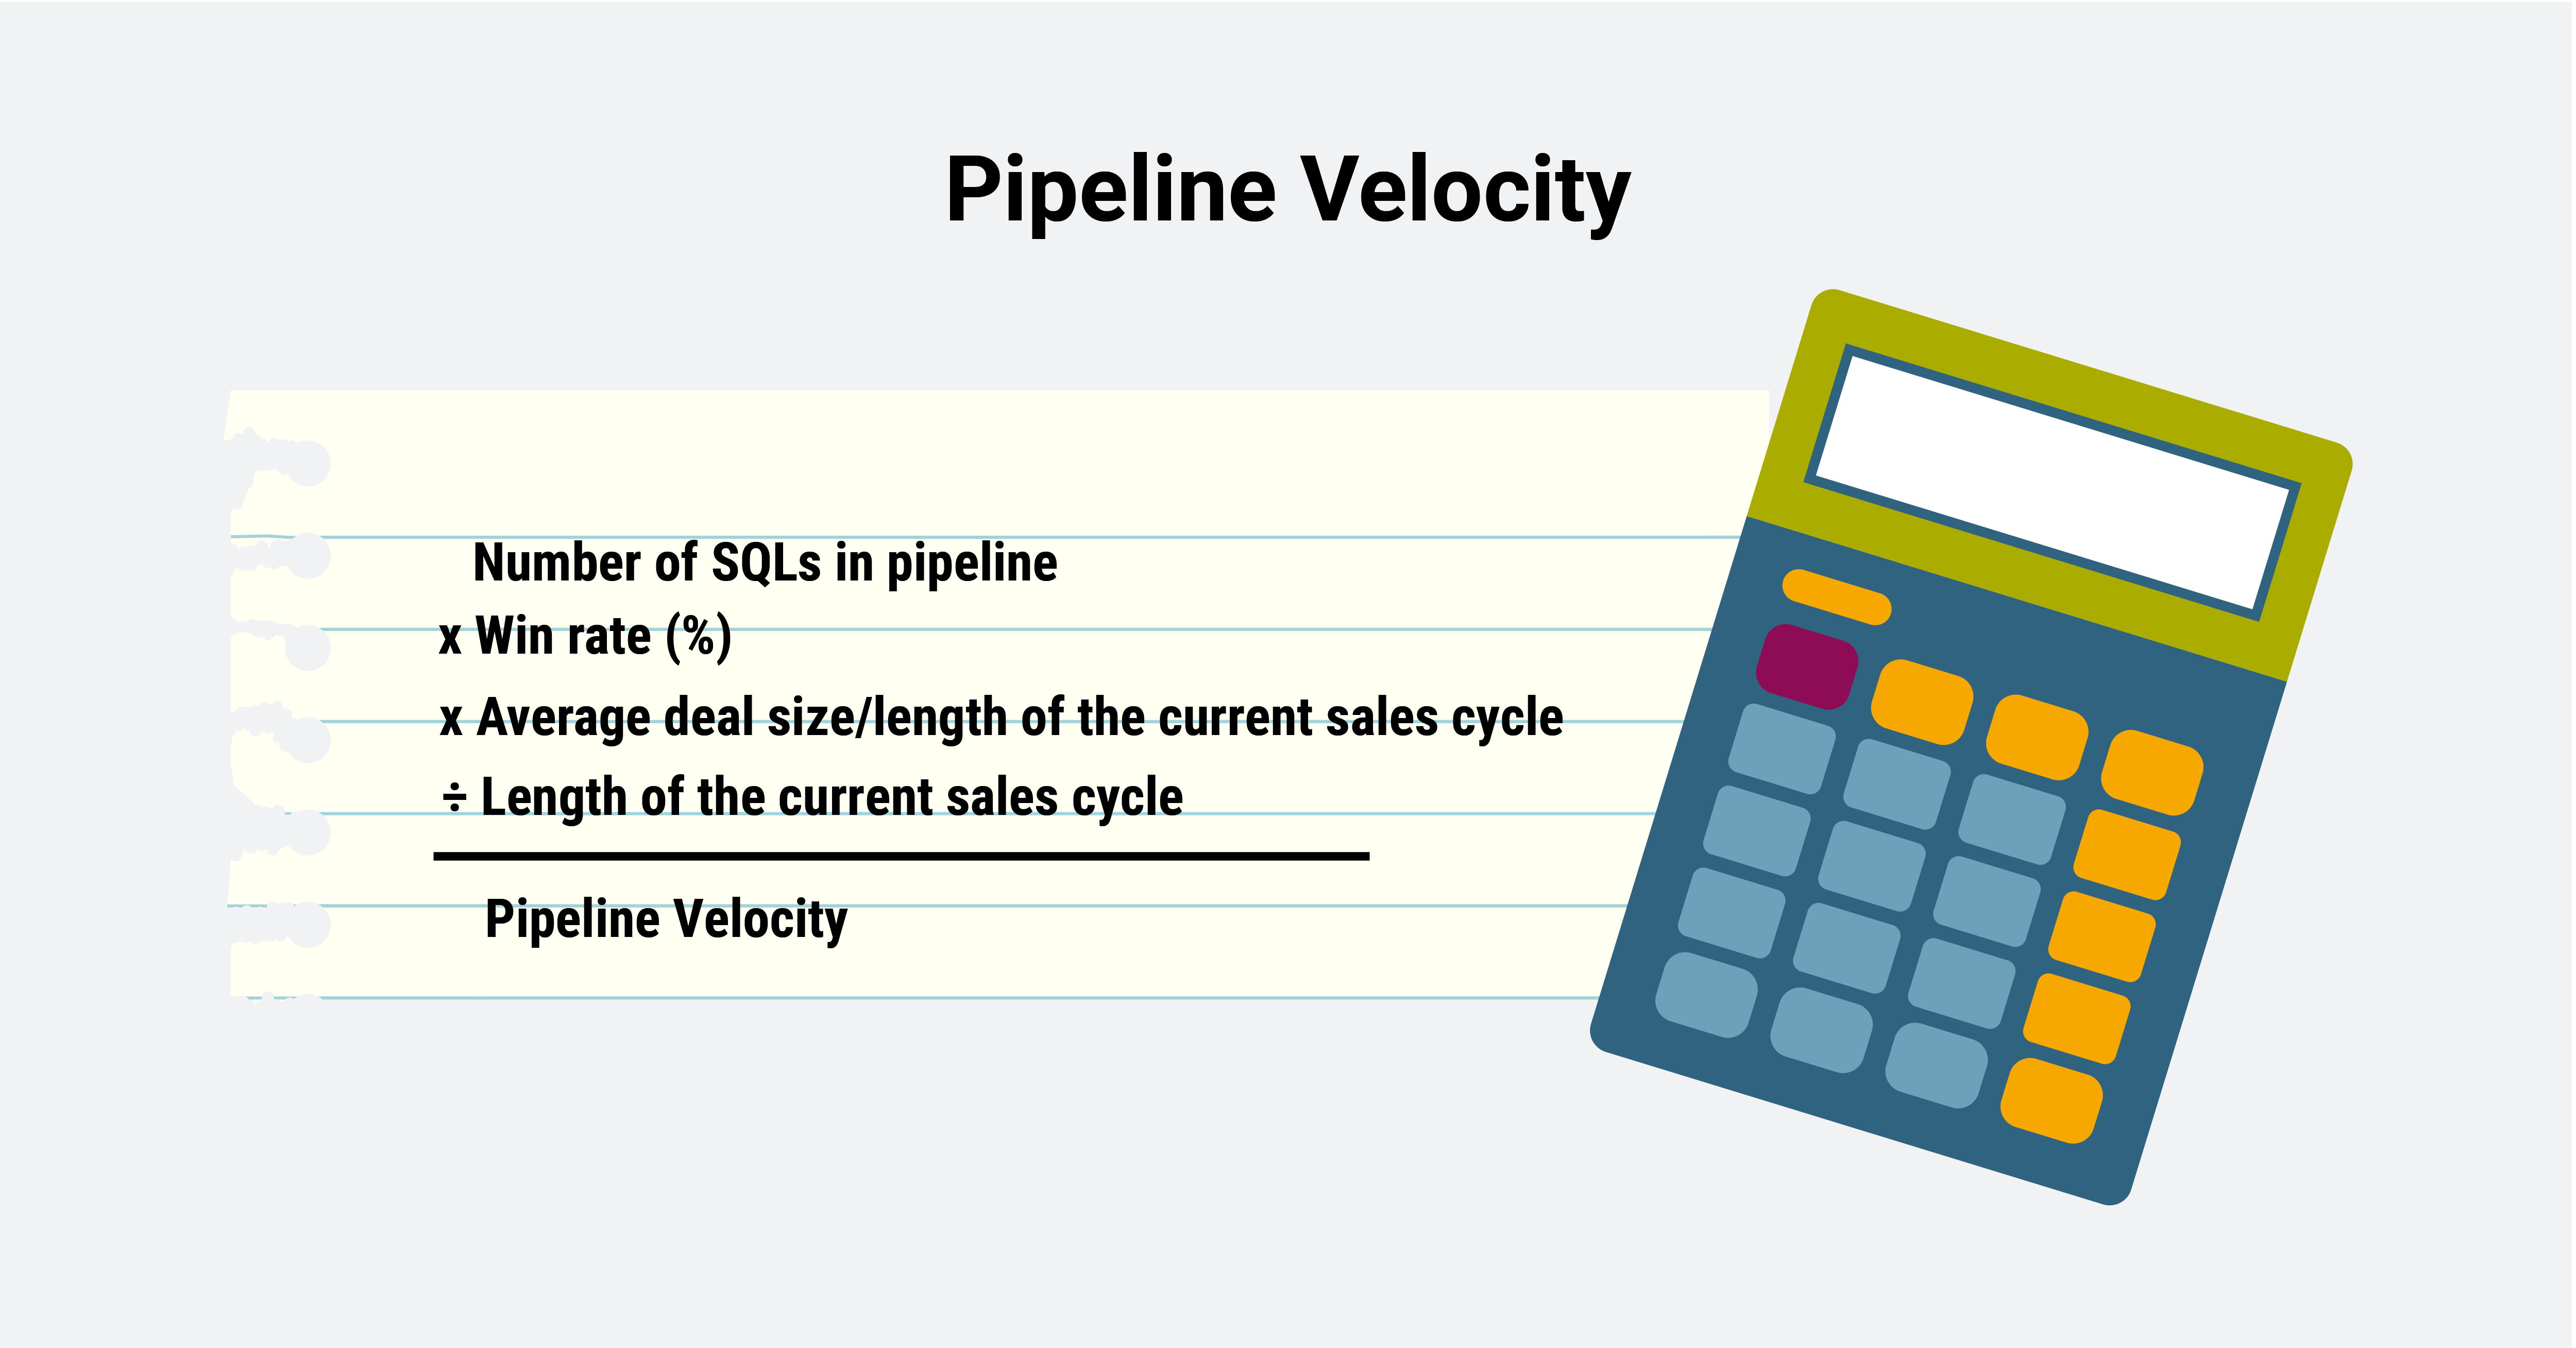
To calculate pipeline velocity, you’ll need to take the number of sales-qualified leads in your pipeline and multiply it by the win rate (percentage) and the average deal size, then divide by the length of your current sales cycle in days.
Formula for pipeline velocity: number of SQLs in pipeline x win rate (%) x average deal size / length of the current sales cycle
8. Customer Satisfaction
While it may not be quite as objective as some of the other metrics on this list, customer satisfaction is still essential to measure when it comes to RevOps. After all, the goal of RevOps is to drive predictable and sustainable growth, and knowing how to best meet current and future customer needs is key.
Using survey methods like Net Promoter Score (NPS) can help you gauge how customers feel about your brand, products, services, and their experiences — allowing you to better understand your customers and how loyal and committed they are. Over time, this will allow you to deliver better customer experiences, build stronger relationships, and ultimately drive more revenue.
Data Is Your Friend, Always
Driving predictable growth requires data. There is no way around it. Without it, knowing what levers to pull to generate revenue is virtually impossible. Today’s companies are blessed with more data and more robust analytics and tracking tools than ever before — and the options are growing fast.
Navigating the sea of information can be overwhelming. It’s a common concern our clients raise when getting started. The key to winning with data is to select a few key metrics that really matter to your business to track and align with your overarching strategy.